
Downloads
Click on the underlined links below to download the files. All data files with a “.zip” or “.rar” at the end need to be unzipped after downloading (using WinZIP, WinRAR, 7-Zip, or a similar program). Please regard Conditions of Use for all Rainfall Atlas products and refer to our How To Cite page for citation information.
All mean map products use the 30 year base period 1978-2007.
*Added October, 2018: Rainfall Trend Maps from 1920-2012 & 1983-2012. See the Rainfall Trend Maps section below.
*Added December, 2015: Interactive map links for Month-Year Rainfall Maps from 1920-2012. See the Month-Year Maps section below.
*Added August, 2015: Month-Year Rainfall Maps from 1920-2012. See the Month-Year Maps section below.
*Added April, 2015: Raingage station data (through 2012). See the Tabular section below.
**The Moloka‘i maps have been updated! (07/2014) Using new information from stream gauges and additional vegetation data, we have a produced improved maps of mean rainfall for the island of Moloka‘i. All files below have been updated with these new maps.**
Image files of the color zone rainfall maps as well as the isohyets have been created and are available for download as *.TIF files. The user has a choice of inches or millimeters, and each compressed *.zip file contains all 12 months plus the annual map. The color maps are available at a statewide extent as well as for each county, while the isohyets maps are only available for each island county (Maui Nui includes the islands of Maui, Moloka‘i, Lāna‘i and Kaho‘olawe).
Isohyets:

These images show the mean monthly rainfall as isohyets, or lines of equal rainfall. Both sets of isohyets (inches and mm) were created at appropriate intervals for their units, and therefore are not direct conversions of each other, though they are derived from the same data. The labels are included where they can fit, which means that not all isohyets are labeled, especially in steep gradient areas. Please see the interactive map or download the GIS or Google Earth layers for more information on isohyets labels.
Files for download:
| Coverage | Inches | Millimeters |
|---|---|---|
| Hawai‘i | HawaiiIsohyetTIFs_inches.zip | HawaiiIsohyetTIFs_mm.zip |
| Kaua‘i | KauaiIsohyetTIFs_inches.zip | KauaiIsohyetTIFs_mm.zip |
| Maui Nui | MauiNuiIsohyetTIFs_inches.zip | MauiNuiIsohyetTIFs_mm.zip |
| O‘ahu | OahuIsohyetTIFs_inches.zip | OahuIsohyetTIFs_mm.zip |
Color Maps:

Unlike the interactive map which shows the rainfall as a continuous color ramp, these images display the rainfall in categories. The categories were set based on the natural breaks in the rainfall values for each extent, with the minimum and maximum values in the legend corresponding to the minimum and maximum values shown in the map extent. The categories were set independently for inches and millimeters, so the two sets will differ slightly.
Files for download:
| Coverage | Inches | Millimeters |
|---|---|---|
| State | StateMapTIFs_inches.zip | StateMapTIFs_mm.zip |
| Hawai‘i | HawaiiMapTIFs_inches.zip | HawaiiMapTIFs_mm.zip |
| Kaua‘i | KauaiMapTIFs_inches.zip | KauaiMapTIFs_mm.zip |
| Maui Nui | MauiNuiMapTIFs_inches.zip | MauiNuiMapTIFs_mm.zip |
| O‘ahu | OahuMapTIFs_inches.zip | OahuMapTIFs_mm.zip |
GIS layers of the rainfall isohyets, rainfall grids, raingage stations, and uncertainty have been made available for download. Users can download the isohyets and stations as shapefiles, and the rainfall and uncertainty grids have been made available in ESRI and ASCII grid formats. These are available in either inches or millimeters, and each compressed *.zip file contains all 12 months plus the annual map. Rainfall isohyets and grids are available for the entire state or users can choose to download individual islands (Maui Nui includes the islands of Maui, Moloka‘i, Lāna‘i and Kaho‘olawe). Two station shapefiles are available (the same station information used in the interactive map), and the uncertainty grids are only available at the statewide extent. All files use geographic coordinates, WGS84 datum.
For more information about GIS, how to use GIS layers, or to obtain more Hawai‘i layers, please refer to the Hawai‘i State GIS page, http://www.state.hi.us/dbedt/gis/download.htm. After downloading, users can upload layers to ArcGIS Online to make their own maps as an alternative to using a desktop GIS program, http://www.arcgis.com/home/.
Rainfall Grids:
Raster files are available at 250m resolution (0.00225 x 0.00225 cell size) for each island and for the state. These are available in inches or millimeters, and can be downloaded in ESRI grid format or ASCII grid format. These are the main output of this project, with the isohyets and other products being produced from these grids.
ESRI Grid Format:
ASCII Grid Format:
Rainfall Isohyets:
Rainfall isohyet files are available as polyline shapefiles for each island and for the state. These are available in inches or millimeters, and the "Contour" column in the attribute table contains the isohyet labels. Both sets of isohyets (inches and mm) were created at appropriate intervals for their units, and therefore are not direct conversions of each other, though they are derived from the same data.
Raingage Stations:
Two point shapefiles containing station information are available for download. "RFAtlasStations" refers to the stations used to create the final rainfall atlas maps. "OtherStations" refers to all other stations that have operated in Hawai‘i, but for various reasons could not be included in the final analysis. The data available in the attribute table can also be downloaded as a *.csv or Microsoft Excel *.xslx file (see Tabular Downloads).
| Coverage | Shapefile | Metadata |
|---|---|---|
| State | RFAtlasStationsSHP.zip | RFAtlasStations_Metadata |
| State | OtherStationsSHP.zip | OtherStations_Metadata |
Uncertainty
The uncertainty grids are available at 250m resolution (0.00225 x 0.00225 cell size) for the state. These are available in inches or millimeters, and can be downloaded in ESRI grid format or ASCII grid format. These layers contain the combined standard error from all input sources to the final maps - see Methods for more information.
ESRI Grid Format:
| Coverage | Inches | Millimeters |
|---|---|---|
| State | UncertaintyGrids_inches.zip | UncertaintyGrids_mm.zip |
ASCII Grid Format:
| Coverage | Inches | Millimeters |
|---|---|---|
| State | UncertaintyASCIIGrids_inches.zip | UncertaintyASCIIGrids_mm.zip |
The same files seen in the interactive map have also been converted into *.KML (*.KMZ) files which can be viewed in Google Earth. The stations and isohyets (lines of equal rainfall) will display their attribute information when an element is clicked on in Google Earth. The color rainfall maps do not contain the value information as they do on the interactive site, so the best way to view these in Google Earth is to set the transparency to overlay it onto the imagery. Maui Nui includes the islands of Maui, Moloka‘i, Lāna‘i and Kaho‘olawe.
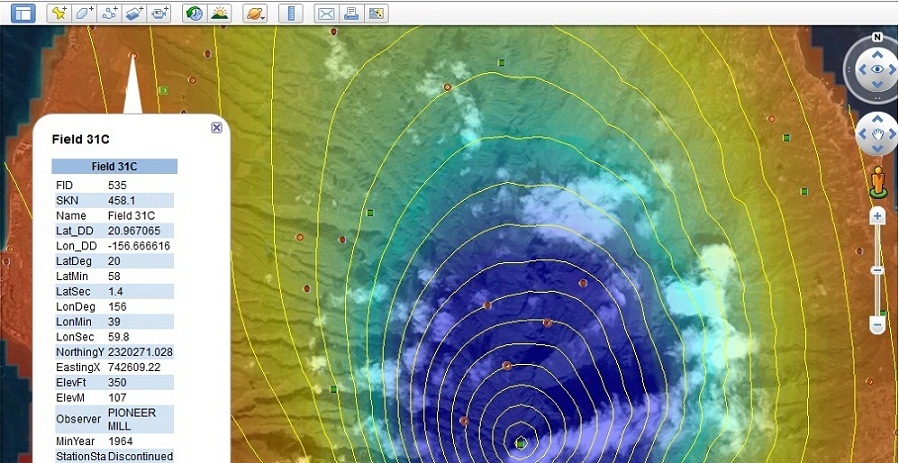
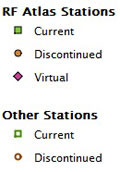
The StationsKML.zip file contains two station files: “RFAtlas Stations” refers to the stations used to create the final rainfall atlas maps. “Other Stations” refers to all the other stations that have operated in Hawai‘i, but for various reasons could not be included in the final analysis. Click on a station for more information. The symbols are set automatically for these stations to be the same as on the interactive map:
The isohyet KMLs are available in inches or millimeters, with “Contour” referring to the isohyet label when you click on a line (labels will not be displayed unless you click on a line). Both sets of isohyets (inches and mm) were created at appropriate intervals for their units, and therefore are not direct conversions of each other, though they are derived from the same data.
| Coverage | Inches | Millimeters |
|---|---|---|
| State | IsohyetsKML_inches.zip | IsohyetsKML_mm.zip |
Color Map KMLs are available by island: (use transparency in Google Earth for best viewing, as no legend is available at this time for these layers):
All station data available for download on our website are monthly totals.
For daily station data, Longman et al. 2018 have compiled and quality controlled the data from 1990-2014 – available for download here.
Added April, 2015: Raingage station data (through 2012):
There are two formats available:
Processed Original Data: data that have been screened for outliers and inhomogeneities, includes data values from all years available at the time of data collection (1837-2013)
Filled Data 1920-2012: data from 1920-2012 with missing values filled whenever possible (see methods)
A “Read_Me” tab has been included with each of these files to further explain the contents.
| Excel 2007 Format |
| Processed Original Monthly Data 2012 |
| Filled Monthly Dataset, 1920-2012 |
Note: We have not compiled rain gauge data beyond 2013 (what is available in the “2012” database above). If you need more current data, please contact the individual agencies that maintain the gages.
NCDC: http://www.ncdc.noaa.gov/cdo-web/
USGS: http://wdr.water.usgs.gov/allsearch.php (climatological sites)
RAWS: http://www.raws.dri.edu/wraws/hiF.html
SCAN: http://www.wcc.nrcs.usda.gov/scan/index.html
WRCC (should be the same stations from NCDC): http://www.wrcc.dri.edu/summary/Climsmhi.html
Hydronet: https://www.weather.gov/hfo/hydronet
HaleNet: https://sites.google.com/a/hawaii.edu/ecohydrology_lab/currentrecent-research/halenet.
Hawai‘i State Climatologist – paper records of rain gauge data are stored in the State Climatologist’s office: http://www.soest.hawaii.edu/MET/Hsco/
Original Rainfall Atlas Products (data end in 2007):
Raingage station data are available in *.csv (comma separated values) format as well as Microsoft Excel *.xlsx format. The mean monthly data are available only for the stations used in the Rainfall Atlas (RFAtlas Stations). The station information for all other stations is available as well (referred to as “Other Stations”). The monthly data are available in three different formats: Processed original data (data that have been screened for outliers and inhomogeneities), Filled Dataset (processed original data plus filled data from 1920-2007, used to create the Rainfall Atlas means), and Raw Original Monthly Data (the original data before removing inhomogeneities and other suspicious records). All data files contain mm and inches.
An “About” tab has been included with each of these files to further explain the contents. For details about the processing or gap filling, please read the final report, available for download below the tabular files.
*NEW* as of August 7, 2015
Month-year rainfall maps for the State of Hawai‘i were created from January 1920 to December 2012 as a spin-off project from the original Rainfall Atlas of Hawai‘i. These maps can be downloaded below in ESRI grid format at 250 m resolution. The rainfall maps are available in either inches or millimeters, and each compressed *.rar file contains monthly and annual maps for every year (1920-2012). In addition to rainfall maps, we have also generated anomaly maps for each month-year, relative to the 1978-2007 (Rainfall Atlas) mean. The anomalies are calculated by dividing the monthly rainfall map by the monthly mean map (January 1920 Anomaly = January 1920 Rainfall / January Mean Rainfall). Units for anomaly maps are dimensionless. For complete methods, see citation below.
Please use the following citation for these maps:
Frazier, A. G., Giambelluca, T. W., Diaz, H. F. and Needham, H. L. (2016), Comparison of geostatistical approaches to spatially interpolate month-year rainfall for the Hawaiian Islands. Int. J. Climatol., 36(3), 1459-1470. doi: 10.1002/joc.4437
The link to the full article is here.
ESRI Grid Format:
| Coverage (File Size) | Inches | Millimeters | Anomaly |
|---|---|---|---|
| State (1.1 GB) | State_RFGrids_1920_2012_in | State_RFGrids_1920_2012_mm | State_AnomGrids_1920_2012 |
| Hawai‘i (650 MB) | Hawaii_RFGrids_1920_2012_in | Hawaii_RFGrids_1920_2012_mm | Hawaii_AnomGrids_1920_2012 |
| Kaua‘i (110 MB) | Kauai_RFGrids_1920_2012_in | Kauai_RFGrids_1920_2012_mm | Kauai_AnomGrids_1920_2012 |
| O‘ahu (120 MB) | Oahu_RFGrids_1920_2012_in | Oahu_RFGrids_1920_2012_mm | Oahu_AnomGrids_1920_2012 |
| Maui (155 MB) | Maui_RFGrids_1920_2012_in | Maui_RFGrids_1920_2012_mm | Maui_AnomGrids_1920_2012 |
| Lāna‘i (28 MB) | Lanai_RFGrids_1920_2012_in | Lanai_RFGrids_1920_2012_mm | Lanai_AnomGrids_1920_2012 |
| Moloka‘i (50 MB) | Molokai_RFGrids_1920_2012_in | Molokai_RFGrids_1920_2012_mm | Molokai_AnomGrids_1920_2012 |
*NEW* as of December 11, 2015
Interactive Map Links (hosted by the PICCC Conservation Planning Atlas):
Annual Maps 1920-2012
Month-Year Maps 1920-1929
Month-Year Maps 1930-1939
Month-Year Maps 1940-1949
Month-Year Maps 1950-1959
Month-Year Maps 1960-1969
Month-Year Maps 1970-1979
Month-Year Maps 1980-1989
Month-Year Maps 1990-1999
Month-Year Maps 2000-2012
From the month-year maps we have generated Statewide and Island average monthly time series. Each index is the average of all map pixels for that month-year. These are available for download in Microsoft Excel (*.xlsx) and CSV (*.csv) formats. Each file contains the average rainfall values in millimeters and inches.
Average time series derived from month-year maps:
Again, please use the following citation for these rainfall indices:
Frazier, A. G., Giambelluca, T. W., Diaz, H. F. and Needham, H. L. (2016), Comparison of geostatistical approaches to spatially interpolate month-year rainfall for the Hawaiian Islands. Int. J. Climatol., 36(3), 1459-1470. doi: 10.1002/joc.4437
*NEW* as of October 10, 2018
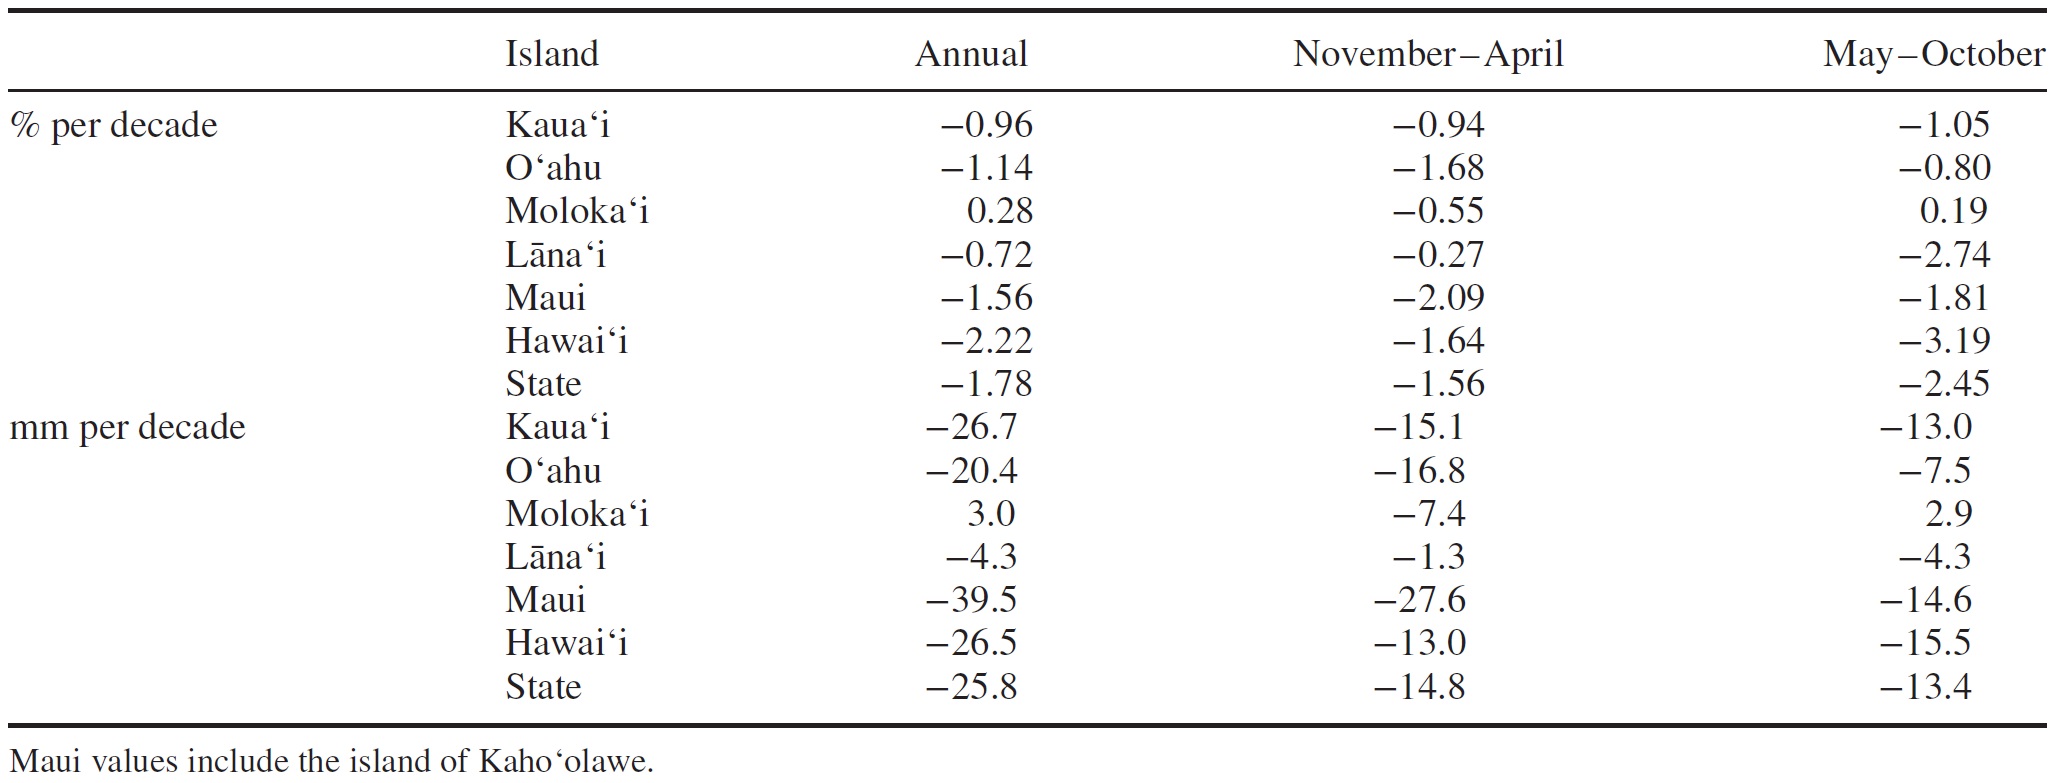
Month-year rainfall maps for the State of Hawai‘i (see data tab above) were used to calculate rainfall trends from 1920 to 2012, and for the most recent 30-year period available, 1983-2012. Wet season (November-April), Dry season (May-October), and Annual trends were calculated at each 250 m pixel across the state and mapped to produce spatially continuous trend maps. Statistically significant trends (p<0.05) are indicated with black hatching. Units are percent per decade (relative to the Rainfall Atlas 1978-2007 means). Trend maps can be downloaded as JPEG images below for each island. For complete methods, see citation below.
Please use the following citation for these rainfall trend maps:
Frazier, A. G., and Giambelluca, T. W. (2017), Spatial trend analysis of Hawaiian rainfall from 1920 to 2012. Int. J. Climatol., 37(5), 2522-2531. doi: 10.1002/joc.4862
The link to the full article is here.
JPEG Images Statewide:


| Spatial Coverage & Season | 1920-2012 Trends | 1983-2012 Trends |
|---|---|---|
| State: Annual Trends | State Annual Trends, 1920-2012 | State Annual Trends, 1983-2012 |
| State: Wet Season Trends | State Wet Season Trends, 1920-2012 | State Wet Season Trends, 1983-2012 |
| State: Dry Season Trends | State Dry Season Trends, 1920-2012 | State Dry Season Trends, 1983-2012 |
JPEG Images Statewide (panels):


| Spatial Coverage & Season | 1920-2012 Trends | 1983-2012 Trends |
|---|---|---|
| State (panels): Annual Trends | State Annual Trends, 1920-2012 | State Annual Trends, 1983-2012 |
| State (panels): Wet Season Trends | State Wet Season Trends, 1920-2012 | State Wet Season Trends, 1983-2012 |
| State (panels): Dry Season Trends | State Dry Season Trends, 1920-2012 | State Dry Season Trends, 1983-2012 |
JPEG Images by Island (Annual, Wet Season, Dry Season):


| Spatial Coverage | 1920-2012 Trends | 1983-2012 Trends |
|---|---|---|
| Hawai‘i Island | Hawai‘i Island Seasonal Rainfall Trends, 1920-2012 | Hawai‘i Island Seasonal Rainfall Trends, 1983-2012 |
| Kaua‘i | Kaua‘i Seasonal Rainfall Trends, 1920-2012 | Kaua‘i Island Seasonal Rainfall Trends, 1983-2012 |
| O‘ahu | O‘ahu Seasonal Rainfall Trends, 1920-2012 | O‘ahu Island Seasonal Rainfall Trends, 1983-2012 |
| Maui | Maui Seasonal Rainfall Trends, 1920-2012 | Maui Island Seasonal Rainfall Trends, 1983-2012 |
| Lāna‘i & Moloka‘i | Moloka‘i and Lāna‘i Seasonal Rainfall Trends, 1920-2012 | Moloka‘i and Lāna‘i Seasonal Rainfall Trends, 1983-2012 |
| Maui Nui (Maui, Moloka‘i, Lāna‘i, and Kaho‘olawe) | Maui Nui Seasonal Rainfall Trends, 1920-2012 | Maui Nui Island Seasonal Rainfall Trends, 1983-2012 |
Mean 1920–2012 trends for each island and season in percent per decade based on the 1978–2007 mean, and mm per decade:
Again, please use the following citation for these rainfall trend maps:
Frazier, A. G., and Giambelluca, T. W. (2017), Spatial trend analysis of Hawaiian rainfall from 1920 to 2012. Int. J. Climatol., 37(5), 2522-2531. doi: 10.1002/joc.4862